 Chandni Sharma
Why Tableau is a Powerful Tool
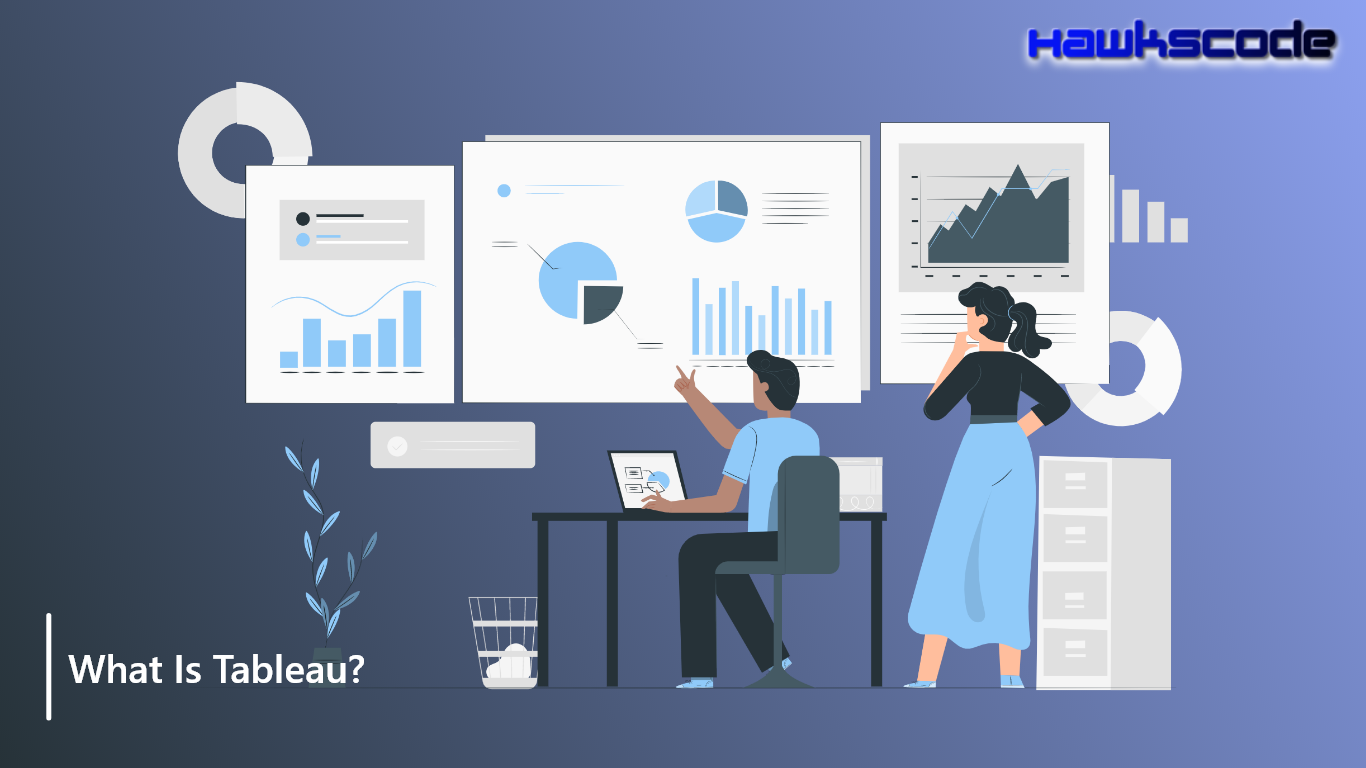
Today, we will discuss What is Tableau?. Many professionals in Business Intelligence, Business Analysis, and Data Analytics are familiar with this tool. But you might wonder, is it related to data? Does it help in organizing data? The answer is yes—it simplifies raw data into a format that is easy to understand.
Tableau is a powerful data visualization tool that is rapidly gaining popularity in the BI, BA, and Data Analytics industry. It makes data analysis faster, and the visualizations created are presented in dashboards and worksheets. Even non-technical users can create dashboards using Tableau. Learn more through online courses available on Easyshiksha.
Firstly, Understand the Concept of Virtualization
Data virtualization is the graphical representation of data. Text-based data is transformed into charts, tables, infographics, and more. This helps reveal new insights and patterns, making it easier to understand. Tableau plays a key role in Business Intelligence. Now, you should have a better understanding of What Tableau is and why it is a powerful tool.
Three Key Features in Tableau that Help in Efficient Data Analysis
- Data Blending
- Real-time Analysis
- Data Collaboration
Tableau was founded by Pat Hanrahan, Christian Chabot, and Chris Stolte in 2003. It has excellent mapping functionality, which allows users to plot coordinates and connect to spatial files. Tableau became popular due to its easy drag-and-drop functionality, speed compared to other BI tools, scalability for both individual and enterprise needs, mobile compatibility, and the ability to connect to a wide variety of data sources without purchasing additional connector licenses. It also boasts big data analytics capabilities, among other features.
To learn more about technologies like this, visit Hawkscode and Easyshiksha. Check out my new blog about humanoid robots and living with robots.
Share Post
Related reading
 Thinking innovatively about the risks of tech
Thinking Innovatively About the Risks of Tech Innovation In today’s...
 Project Maven- Google Ended Its Contract with Pentagon (DoD)
Project Maven- Google Ended Its Contract with Pentagon (DoD) Google’s...
 Top 10 Web Design Tools: Free, Responsive, New and Best- II
Top 10 Web Design Tools: Free, Responsive, New and Best-...
 Wear OS is getting Updates in Google Assistant
Wear OS is getting Updates in Google Assistant Google is...